
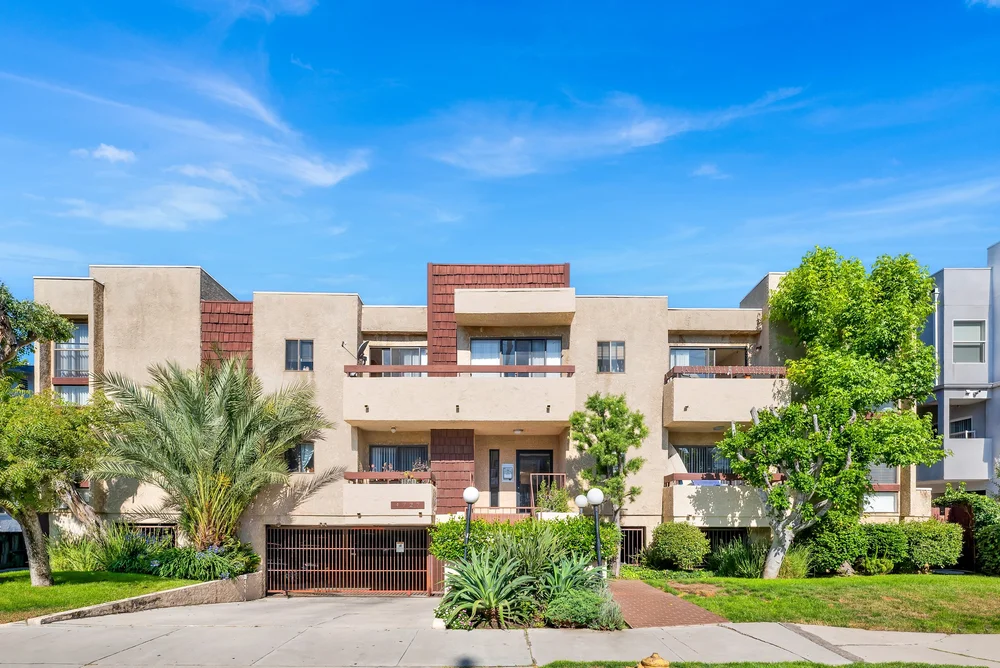
Front of 4727 Kester Avenue, Sherman Oaks
Quick answer: Published 2026 reports put the average Los Angeles apartment cap rate between about 5.4% and 5.9%. Matthews reported 5.41% for Q3 2026. Northmarq reported a 5.9% average for sales through mid-2026, with Class A buildings closer to 4.5% and lower-tier buildings around 6.5% to 7.0%. By area, Northmarq reported about 5.0% for West Los Angeles, 5.3% for the San Fernando Valley and 6.1% for Downtown. On 55 apartment and mixed-use sales The Saghian Group has closed in the Los Angeles area with a published cap rate, the figures run from 1.95% to 6.87%, with a middle value of about 4.8%.
Cap rate is one of the first numbers buyers, lenders and appraisers use to value your building, and a small change in it moves your price. This guide sets two sources side by side: the 2026 market reports that track Los Angeles as a whole, and the cap rates on our own closing pages, neighborhood by neighborhood. Every figure links to its source, so you can check it.
What a Cap Rate Is
A capitalization rate, or cap rate, is a building's net operating income (NOI) divided by its price. NOI is the rent and other income the building collects, minus operating expenses such as property taxes, insurance, utilities, repairs and management, before any mortgage payment.
If a building produces $250,000 of NOI and sells for $5,000,000, the cap rate is 5%. A lower cap rate means a buyer paid more for each dollar of current income. A higher cap rate means the buyer paid less for each dollar of current income, often because the buyer sees more risk, more work or less room to grow rents.
Buyers also look at the gross rent multiplier (GRM), which is price divided by annual gross rent, and at price per unit and per square foot. Our guide to apartment building comps in Los Angeles explains how these numbers are used together.
2026 Market Averages for Los Angeles
These are the most recent published figures we could verify. Each firm uses its own data and methods, so the averages do not match exactly.
| Source | Period | Area | Average cap rate |
|---|---|---|---|
| Matthews | Q3 2026 | Los Angeles market | 5.41% |
| Matthews | Q2 2026 | Los Angeles market | 5.37% |
| Northmarq | 2026 through Q2 | Los Angeles, all classes | 5.9% |
| Northmarq | 2026 through Q2 | Class A buildings | about 4.5% |
| Northmarq | 2026 through Q2 | Lower-tier buildings | 6.5% to 7.0% |
| Northmarq | 2026 through Q2 | West Los Angeles | 5.0% |
| Northmarq | 2026 through Q2 | San Fernando Valley | 5.3% |
| Northmarq | 2026 through Q2 | Downtown Los Angeles | 6.1% |
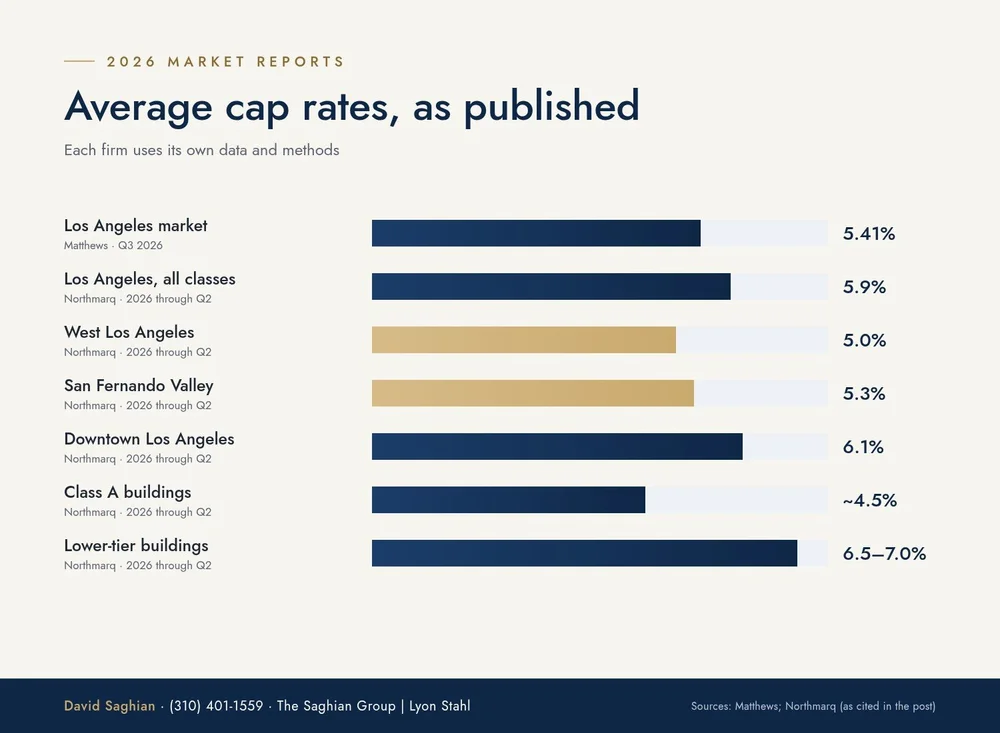
Published market averages. Your building's cap rate depends on its own income, location and rent rules.
A few points from those reports are worth knowing:
- Cap rates have been rising. Matthews reported that the Los Angeles average has risen for 19 straight quarters, with pricing at about $308,000 per unit in Q3 2026.
- The Westside has stayed in a narrow band. Northmarq reported that West Los Angeles cap rates have ranged between 4.0% and 5.0% since 2020.
- The Valley moved slightly lower this year. Northmarq put the San Fernando Valley at 5.3% through mid-2026, down from an average of 5.5% in 2025.
- The South Bay has moved higher. Northmarq reported South Bay cap rates of about 5.0% in 2024 and 5.75% in 2025, approaching 7.0% in recent months.
Cap Rates on Our Own Closings, by Neighborhood
Market averages blend many different buildings and sales. Our closing pages show the cap rate on specific sales, with the address, unit count and terms. The table below covers apartment and mixed-use sales in the Los Angeles area that have a published cap rate. It leaves out land, retail, single-family and development-site sales, and sales outside California.
These cap rates are as published on each closing page at the time of sale. The sales closed in different years and interest-rate environments, so treat them as examples of how buildings like yours have traded, not as a 2026 quote. The table includes sales led by team member Tony Sameyah, which are credited to him on their closing pages.
| Area | Sales with a published cap rate | Range | Examples |
|---|---|---|---|
| Studio City | 5 | 3.95% to 5.52% | 4180 Arch Dr (36 units, 5.4%); 4454 Coldwater Canyon Ave (15 units, 3.95%) |
| Sherman Oaks | 6 | 3.90% to 5.49% | 4727 Kester Ave (15 units, 4.64%); 14926 Dickens St (8 units, 5.13%) |
| Valley Village | 5 | 4.2% to 5.54% | 12015 Kling St (24 units, 5.54%); 5240 Whitsett Ave (14 units, 4.37%) |
| North Hollywood | 7 | 3.6% to 6.69% | 10828 Hesby St (5 units, 6.69%); 11040 Hesby St (19 units, 4.87%, sold by Tony Sameyah) |
| Van Nuys | 5 | 3.94% to 5.44% | 14833 Erwin St (5.44%) and 5721 Tilden Ave (5 units, 3.94%), both sold by Tony Sameyah |
| West Valley (Canoga Park, Winnetka, Tarzana, Encino) | 5 | 4.31% to 5.36% | 16300 Ventura Blvd (mixed-use, 49 apartments, 5.36%); 20301 Cohasset Ave (22 units, 5.11%) |
| Burbank | 5 | 3.29% to 4.59% | 4100 McFarlane Ave (13 units, 4.20%); 1501 N Hollywood Way (6 units, 3.94%) |
| Glendale | 2 | 3.81% to 5% | 1060 Raymond Ave (20 units, 5%); 114 E Lomita Ave (10 units, 3.81%, buyer side) |
| West Hollywood, Beverly Grove and Mid-City | 4 | 2.93% to 6.87% | 540 N Orlando Ave (17 units, 5.45%); 1414 S Orange Dr (5 units, 6.87%) |
| Westside (West LA, Brentwood, Cheviot Hills, Rancho Park, Westchester, Beverly Hills) | 6 | 1.95% to 6.18% | 1316 and 1322 S Centinela Ave (20 units, 5.35%, buyer side); 2372 S Beverly Glen Blvd (8 units, 4.73%) |
| Northeast and Central LA (Highland Park, Cypress Park, Los Feliz, Westlake) | 4 | 2.91% to 6.04% | 3401-3405 N Figueroa St (mixed-use, 26 apartments, 6.04%); 5745 Arroyo Dr (6 units, 5.28%) |
| South Bay (Redondo Beach) | 1 | 4.9% | 18218 Mansel Ave (3 units, 4.9%, buyer side) |
Across all 55 sales, the published cap rates run from 1.95% to 6.87%, with a middle value of about 4.8%. Among the 21 sales of buildings with 10 or more units, the middle value is about 5.1%. Among the 24 sales of buildings with fewer than 10 units, it is about 4.4%. You can sort every sale by cap rate on our track record page.
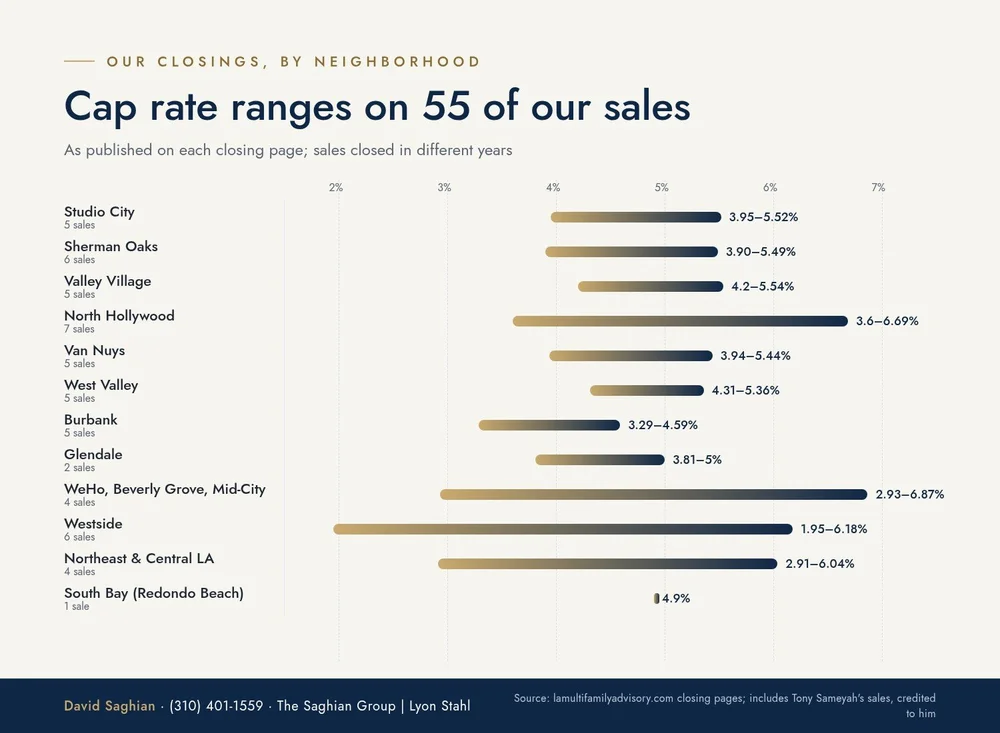
Middle value across all 55 sales: about 4.8%. Treat these as examples of how buildings traded, not a 2026 quote.
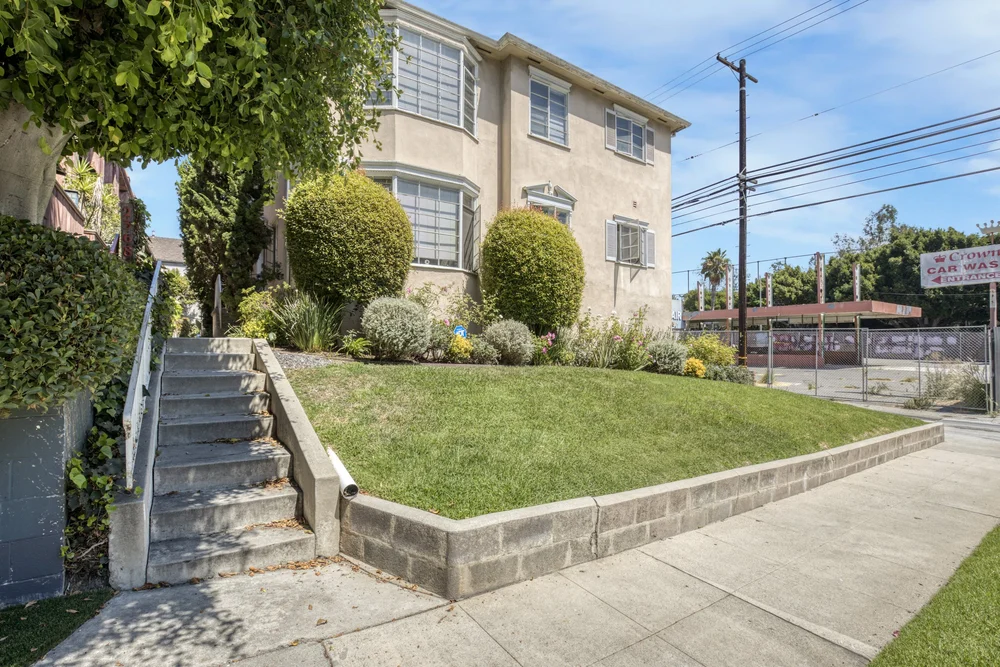
Front of 2372 S Beverly Glen Boulevard, West Los Angeles
Why Our Numbers Sit Below the 2026 Averages
Most of our published cap rates are lower than the 5.4% to 5.9% averages in the 2026 reports. There are three main reasons, and they matter when you read any cap rate.
- Timing. Some of these sales closed when interest rates were lower. For example, 4913-15 Cahuenga Blvd in North Hollywood, sold by Tony Sameyah, closed on September 29, 2021. Market reports show cap rates rising since then.
- Location. Most of our sales with a published cap rate are in the San Fernando Valley, Burbank, Glendale and the Westside. Northmarq's 2026 figures for West Los Angeles (5.0%) and the San Fernando Valley (5.3%) were already below its countywide average of 5.9%.
- Rent upside. Many of these buildings had rents well below market. Buyers pay more for that upside, which pushes the cap rate on current income down.
What Moves a Cap Rate Up or Down
The examples on our closing pages show the same patterns the market reports describe.
Room to raise rents lowers the cap rate on today's income. 9312 W Olympic Blvd, a 6-unit Art Deco building in Beverly Hills, sold off market at a 1.95% cap rate. The buyer planned to add two ADUs. 107 S Clark Dr in Beverly Grove sold at 2.93% with about 35% upside in rental income listed on its closing page.
Small buildings that suit an owner-occupant trade at lower cap rates. 1900 N Normandie Ave, an owner-user duplex in Los Feliz, sold at 2.91%. Duplex, triplex and fourplex buyers often compare the price with buying a house, not only with the income. See our 2-4 unit page.
Larger buildings with steady income cluster near 5% to 5.5%. 4180 Arch Dr (36 units, 5.4%), 12015 Kling St (24 units, 5.54%), 540 N Orlando Ave (17 units, 5.45%) and 1060 Raymond Ave (20 units, 5%) all fall in that range.
Strong current cash flow raises the cap rate. 5462 Alvern Circle in Westchester sold at 6.18% with about 23% rental upside remaining. 10828 Hesby St in North Hollywood sold at 6.69%.
Rent rules and jurisdiction matter. A building under the City of Los Angeles Rent Stabilization Ordinance (RSO) has a different rent path than one governed only by AB 1482, such as 4180 Arch Dr (built in 1990) or 4727 Kester Ave (built in 1984). Separate cities like Burbank, Glendale, Beverly Hills and West Hollywood have their own rules and are outside Measure ULA. See AB 1482 vs. LA rent control and our Measure ULA guide.
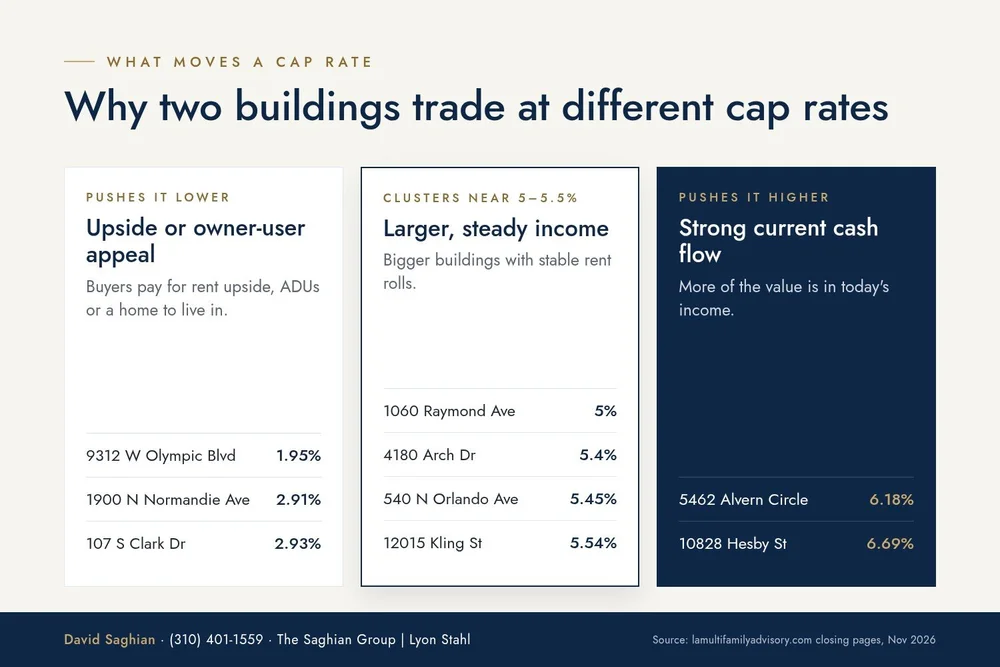
A cap rate is a result, not a starting point.
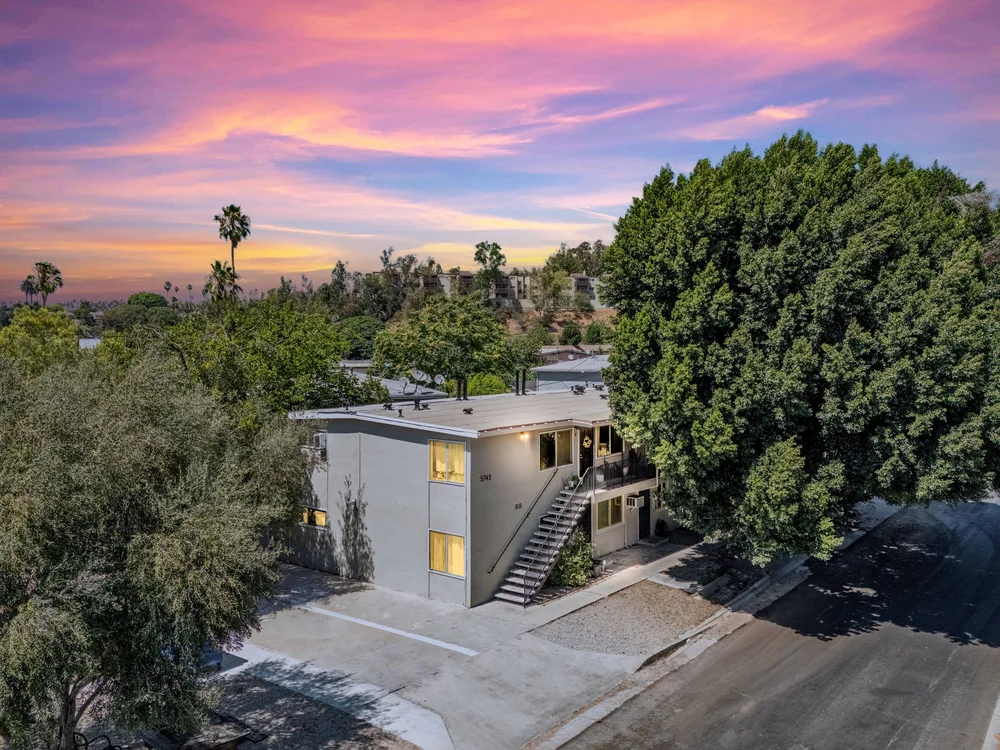
5745 Arroyo Drive, Highland Park
How to Use These Numbers to Price Your Building
A cap rate is a result, not a starting point. To estimate yours:
- Start with your actual rent roll and trailing 12 months of income and expenses.
- Adjust expenses to what a buyer will underwrite, including a reassessed property tax and current insurance.
- Compare your building with closed sales of similar size, age, rent status and location, not with a citywide average.
- Separate today's income from future rent upside, and know what the law allows a new owner to do.
- Look at what you will keep, not just the price. Our net proceeds guide shows how.
A Los Angeles multifamily broker should be able to show you the closed sales behind any cap rate they quote. You can review ours on the Los Angeles multifamily broker page, the San Fernando Valley page and the West Los Angeles page. For a range based on your building's own numbers, call David Saghian at (310) 401-1559 or request a free property valuation.
Frequently Asked Questions
What is the average cap rate for Los Angeles apartment buildings in 2026?
Published reports put it between about 5.4% and 5.9%. Matthews reported 5.41% for Q3 2026, and Northmarq reported 5.9% for sales through mid-2026, with Class A buildings near 4.5% and lower-tier buildings around 6.5% to 7.0%.
What are cap rates in the San Fernando Valley and on the Westside?
Northmarq reported an average of about 5.3% for the San Fernando Valley and 5.0% for West Los Angeles for sales through mid-2026. On The Saghian Group's own closings, Studio City sales ranged from 3.95% to 5.52% and Sherman Oaks sales from 3.90% to 5.49%.
What cap rates have The Saghian Group's apartment sales closed at?
On 55 Los Angeles-area apartment and mixed-use sales with a published cap rate, the figures run from 1.95% to 6.87%, with a middle value of about 4.8%. Each sale has its own closing page with the address and details.
Why do some Los Angeles apartment buildings sell below a 4% cap rate?
Usually because buyers are paying for something beyond current income, such as rents well below market, room to add ADUs, an owner-occupant use, or a location buyers expect to hold its value. The cap rate on today's income is low, but the buyer expects it to rise.
How is a cap rate calculated?
Divide the building's net operating income by its price. Net operating income is rent and other income minus operating expenses such as taxes, insurance, utilities, repairs and management, before any mortgage payment.
Does rent control change a building's cap rate?
It can. Rent rules limit how fast a new owner can raise rents, which affects what buyers will pay. Know whether your building is under the City of Los Angeles RSO, only statewide AB 1482, or a separate city's rules before you compare cap rates.
How can I find out what my building would sell for?
Start with your rent roll and trailing 12 months of income and expenses, then compare them with closed sales of similar buildings nearby. You can call David Saghian at (310) 401-1559 or request a free property valuation. David Saghian is licensed with Lyon Stahl Investment Real Estate, DRE 01992252.